Everything I Wanted To Know About Kubernetes Autoscaling
Kubernetes is today the most well-known container scheduler used by thousands of companies. Being able to quickly and automatically scale your application is something standard nowadays. However, knowing how to do it well is another topic. In this article, we'll cover how pod autoscaling works, how it can be used, when it's exciting and not, and finally, we'll cover it with a Qovery usage we have internally.

Pierre Mavro
November 29, 2022 · 9 min read
Basics
From Kubernetes documentation:
A HorizontalPodAutoscaler (HPA for short) automatically updates a workload resource (such as a Deployment or StatefulSet), with the aim of automatically scaling the workload to match demand.
Horizontal scaling means that the response to increased load is to deploy more Pods. This is different from vertical scaling, which for Kubernetes would mean assigning more resources (for example: memory or CPU) to the Pods that are already running for the workload.
If the load decreases and the number of Pods is above the configured minimum, the HorizontalPodAutoscaler instructs the workload resource (the Deployment, StatefulSet, or other similar resource) to scale back down.
So basically, the most common and basic usage we can see is on the CPU resources. If we take an example of an application consuming CPU, we can define new instances (pods) to be created if the CPU of the current instance goes above a certain amount of CPU. It will automatically be reduced after a defined time under the defined threshold.
There are three kinds of scaling:
- Horizontal scaling: your application can have multiple instances. As soon as you need to support more workload, new instances will pop up to handle it. Scaling ends when the limit you've set has been reached or when no more nodes can be used to support your workload (and so new instances to be created).
- Vertical scaling: your application cannot run in parallel, so leveraging the current resources is the way to scale. Scaling issues occur when you reach the physical machine limits (and, in this case, your application is not highly available). Being able to have multiple instances with vertical scaling is possible but rare.
- Multi-dimensional scaling: less frequent, it combines horizontal and vertical scaling simultaneously. It's also more complex to manage because defining when to scale horizontally or vertically depends on many parameters, which are sometimes hard to predict.
Simple right? Unfortunately, it doesn't work for every use case. Let's dig into it!
Know your application limits and bottleneck
Applying autoscaling on the CPU doesn't work all the time. Why? Because your application limits may not be (only) CPU side. So before attempting to set an autoscaler on random resources, here are recommendations Qovery shares with our customers.
First, define your application limits. Wait? How to define them?

On an application, several computer resources can be consumed for several reasons:
- CPU: calculation, compression, map reduce...
- Memory: cache data, store to then compute...
- Disk: store big data which can't fit into memory, flush on disk, slower and less frequent access...
- Network: request external data (database, images, videos...), API calls...
If you have written your application, you should know where the bottleneck will happen at first. If you don't or didn't write the application, you will have to load test your application to find resources where the contention will occur.
How to do it? Well, it depends on how your application usage works. For an API REST application, you can use already existing tools to perform HTTP calls to try to saturate the service and see on which resource your application struggle. Some HTTP calls will perform different actions and so consume different resources. A GET action will not do the same as a PUT or a POST. Even between the same kind of GET, you can have one returning a random number, while another can perform multiple database actions, compute them together, sort, etc... so as you can see, each action is different.
It's good to know how they are used (30% of this function corresponds to read database, 10% of others corresponds to writing data on disk, etc...). You can use tools like Datadog or Newrelic to help you make statistics if you already have your application running on production.
It's essential to load tests in the same conditions as production. Thanks to Qovery, cloning an environment instantly is easy! Otherwise, your load testing will be useless. Once you have stress tested your application and have the bottlenecks' results, you will have to consider architecture design changes, or you'll be ready to apply autoscaling. Here are the basic rules for autoscaling:
- CPU: scaling horizontally on CPU is generally one of the easiest ways to scale
- Memory: memory can only scale vertically by design. If your application works this way, re-architecture it to distribute work across several instances is the way to scale and see a bright future. Vertical scaling work for some time, but not when the load comes
- Disk: local disk is the most performant way to flush on disk with the smallest latency and highest throughput. However, it can always be hard to have data available locally (if an application is moving from node to node). Storing on a shared drive is preferable if you care less about performances.
- Network: scaling horizontally on the network is common, but defining the metric on which to scale, may not be that easy (connection number, latency, throughput...)
Covering load testing in this article would be too long. If you're not familiar with it, I can encourage you to read this post.
Qovery use case
At Qovery, we're using autoscaling for several reasons. But to continue in the article spirit, we'll take the Qovery Engine as an example.
What are the Qovery Engine bottlenecks?
- CPU: The engine doesn't consume that much CPU. Even for third-party tooling, it executes, it's fast, and there is not much computation.
- Memory: The engine itself doesn't consume that much memory (a few Mb). However, when It runs Terraform, Terraform itself can consume 500+ Mb per process (with its child processes). So to correctly size pod instances, we limit the number of parallel runs of Terraform in a single instance (it's essential to avoid running pods out of memory)
- Disk: The engine uses local storage to generate configs (Helm, Terraform...), so it only uses temporary local storage with a small amount of size
- Network: no high throughput or small latency is required, but a lot of parallel network calls are made to third parties
Here the bottleneck is memory. To scale on demand, controlling memory usage in the Engine is essential. This is why we horizontally distributed the workload across several Engines and did not choose vertical scaling.
The question you may ask is how do we decide on which resource we scale? Memory is the bottleneck, but scaling on memory doesn't make sense.

However, I mentioned above that we want to scale based on the workload. This means the most demand we have, the most Engines we'll need.
So what is the metric we decided to scale on? Memory can vary depending on the customer's request, so it's not a good one. We created a custom metric based on the Engine number of requests executed in parallel. If an Engine performs tasks, we need to scale up to handle new tasks. If we have five running Engines and only one run, we scale down to 2 pods.
How does it work? For several years now, Prometheus has become the standard of observability by exposing metrics and usage facilities. Here is a summary of the elements required to make it work:

So we implemented a metric for it in the Engine application:
lazy_static! {
    static ref METRICS_NB_RUNNING_TASKS: IntGauge =
        register_int_gauge!("taskmanager_nb_running_tasks", "Number of tasks currently running").unwrap();
}
That simple! So Prometheus is configured with the Prometheus Operator to scrape (look at) Qovery metrics every 5s:
apiVersion: monitoring.coreos.com/v1
kind: ServiceMonitor
metadata:
  labels:
    app.kubernetes.io/instance: qovery-engine
  name: qovery-engine
  namespace: qovery-prod
spec:
  endpoints:
  - interval: 30s
    port: metrics
    scrapeTimeout: 5s
  namespaceSelector:
    matchNames:
    - qovery-prod
  selector:
    matchLabels:
      app.kubernetes.io/instance: qovery-engine
Then with the help of the Prometheus Adapater, we're able to ask Kubernetes API to retrieve Prometheus metrics to then act on the Pod autoscaler with our custom metric:
apiVersion: autoscaling/v2beta2
kind: HorizontalPodAutoscaler
metadata:
  name: qovery-engine
  labels:
    app.kubernetes.io/instance: qovery-engine
spec:
  scaleTargetRef:
    apiVersion: apps/v1
    kind: Deployment
    name: qovery-engine
  minReplicas: 1
  maxReplicas: 30
  metrics:
    - type: Pods
      pods:
        metric:
          name: taskmanager_nb_running_tasks
        target:
          type: AverageValue
          averageValue: 0.5
Here we're operating on the average Value. To simplify, we're going to use one pod = one task. With one single task, as soon as the average of the running pods goes over 1, it will trigger a scaling. In our case, it's binary (there is a task running or not), so it will never scale up.
averageValue set below "1", autoscaling will occur. However, it will still scale accordingly to the average unit of the sum of taskmanager_nb_running_tasks metrics of all Engines. What does that mean? That means the more Engine we'll have running, the more HPA will create pods to anticipate the possible workload.
Over time, we'll adjust this value to avoid taking too many resources for nothing. This is something we monitor and get alerted on. Having graphs to understand how things work is a good practice:

#Enhance autoscaling pod boot time
Autoscaling pods can take some time for several reasons:
- Boot node: If there are not enough resources to boot a new pod on the current nodes in your cluster, Kubernetes can create a new node with cluster autoscaler. Depending on the cloud provider, region, and kind of node...it can take some time. On AWS, the average time we observed at Qovery is 2 min for a new node to boot and integrate the cluster.
- Boot pod (pull image): once there, the pod can be scheduled as new resources are available. The first thing the pod will do is pull the image. Depending on the image size and the image repository location...it can take time as well. It's not rare it takes a few minutes for an image with a few gigabits.
- Application boot delay: depending on the kind of application (JVM based or not) and the operation to perform (data sample injection...), it can take some time and vary from one application to another.
We're using a way to eliminate points 1 and 2 with a minor drawback (cost). The solution is to use overprovisioning pods so that when new Engines want to boot, they don't wait for resource availability, as real Engine pods will replace preempted pods. Preempted pods are already loaded and have already pulled Engine images locally. So boot time becomes drastically better.
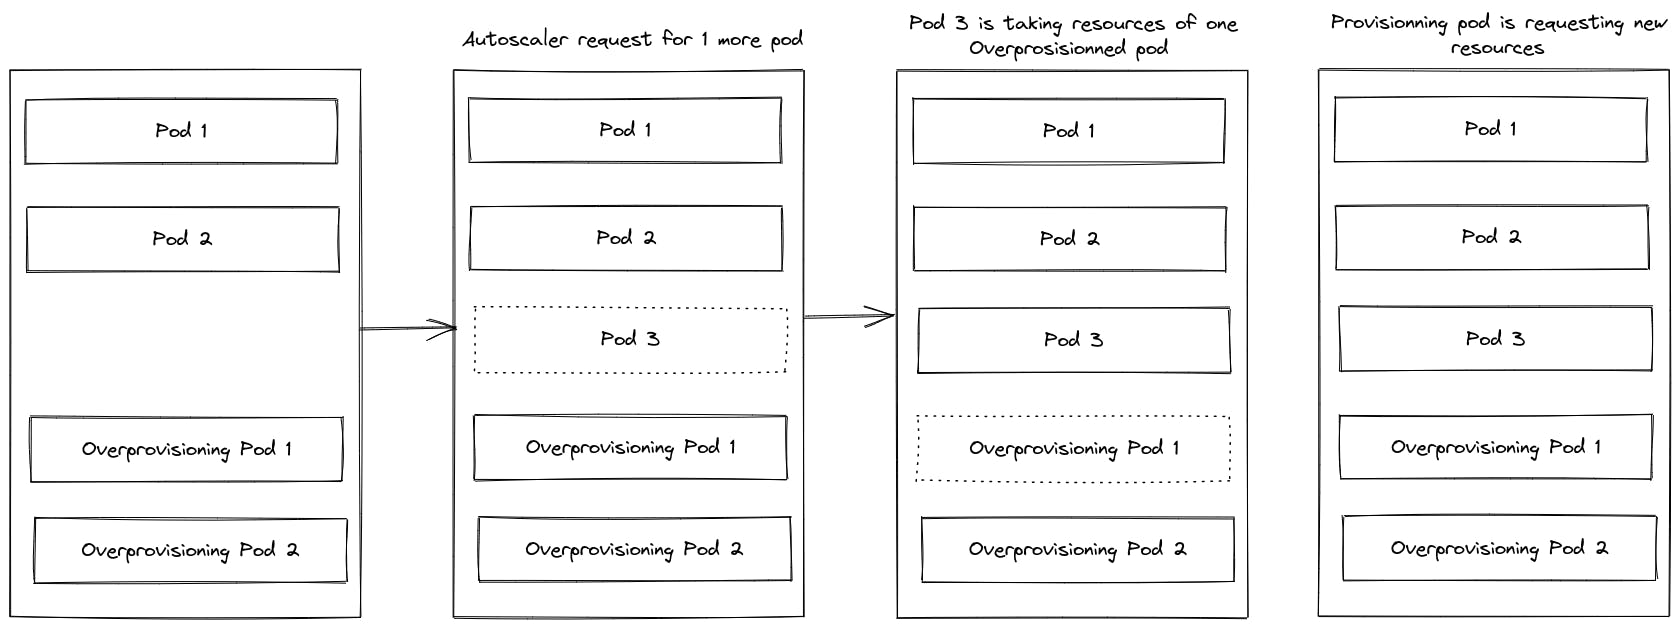
What do you need? First, a priority class, saying we want to have preempting pods (value to -1):
apiVersion: scheduling.k8s.io/v1
kind: PriorityClass
metadata:
  name: qovery-engine-overprovisioning
value: -1
globalDefault: false
And finally, the deployment for the preempting pods. We set some preempted pods in replicas, the same resources as our Engines to ensure we'll be able to allocate in an instance those, and finally, the priorityClassName associated:
apiVersion: apps/v1
kind: Deployment
metadata:
  name: qovery-engine-overprovisionning
  labels:
    app: qovery-engine-overprovisioning
spec:
  replicas: {{ .Values.overprovisionning.replicas }}
  selector:
    matchLabels:
      app: qovery-engine-overprovisioning
  template:
    metadata:
      labels:
        app: qovery-engine-overprovisioning
    spec:
      priorityClassName: qovery-engine-overprovisioning
      containers:
      - name: qovery-engine-overprovisionning
        image: "{{ .Values.image.repository }}:{{ .Values.image.tag }}"
        command: ["/bin/sh", "-c", "tail -f /dev/null"]
        resources:
        {{- toYaml .Values.engineResources | nindent 10 }}
Conclusion
Autoscaling is not magic. Kubernetes helps a lot to make it more accessible, but indeed, the most important thing is knowing your application limits and bottleneck.
Taking time to test, validate, ensuring the behavior is the one expected and regularly load testing your app is crucial to success with autoscaling.
Your Favorite DevOps Automation Platform
Qovery is a DevOps Automation Platform Helping 200+ Organizations To Ship Faster and Eliminate DevOps Hiring Needs
Try it out now!

Your Favorite DevOps Automation Platform
Qovery is a DevOps Automation Platform Helping 200+ Organizations To Ship Faster and Eliminate DevOps Hiring Needs
Try it out now!
